|
Graphism
Graphs
are mechanisms called tables which are used to display different
kinds of information in an easy to understand way. They are often
used to compare two or more kinds of data.
Sometimes graphs represent statistical
information in order to demonstrate how certain numbers of things,
or quantities, relate to other sets of statistical data. For example,
apples and oranges.
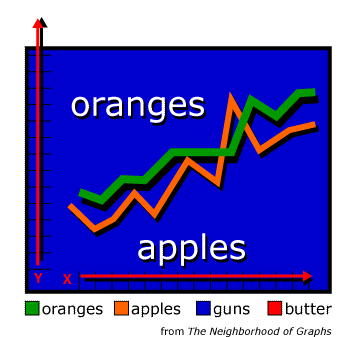
Here we have a simple graph. The X and
Y axes are in a never ending struggle for control of the information
displayed. The graph is a constant reminder of the perfect beauty
of nature. In this graph we see the political comparison of apples
and oranges being expressed non-metaphorically. And because people
prefer oranges to apples, the Y coordinate is able to leave the
graph. It is often said that the fruit of the graph enables the
gears of the marketplace.
|
|
 |


